In the relentless arena of DeFi trading, where microseconds and basis points dictate profits, USDC-USDT swaps demand ruthless efficiency. Slippage isn’t just a metric; it’s the silent killer of yields in low-volatility pairs. Enter the titans: Curve Finance’s Stableswap invariant versus Uniswap V3’s concentrated liquidity pools. Both engineered to slash slippage near the $1 peg, yet one delivers passive precision while the other thrives on active wizardry. Traders chasing low slippage USDC USDT performance must dissect their mechanics to uncover true alpha.

Curve Stableswap vs Uniswap V3: Key Metrics for USDC-USDT Swaps
| Metric 📊 | Curve Stableswap 🌀 | Uniswap V3 🎯 |
|---|---|---|
| Core Mechanism | Hybrid bonding curve (constant sum + product) optimized for 1:1 peg 🧪 | Concentrated liquidity in custom price ranges 📈 |
| Slippage ($1M Swap) | ≈0.01% ⚡ | Low if concentrated around peg, higher if unmanaged ⚠️ |
| Fees | Very low 💰 | Tiered (low options for stables) 💳 |
| Liquidity Efficiency | 75% of Uniswap volume with 1/8 liquidity 🚀 | High capital efficiency but range-bound 🔧 |
| Management Required | Passive ✅ | Active to maintain ranges 🔄 |
| Impermanent Loss Risk | Minimal for stables 🛡️ | Higher outside ranges 😬 |
| Ideal For | Large passive stablecoin swaps 🐘 | Managed high-efficiency trades 🏎️ |
Curve Stableswap’s Hybrid Beast: Conquering Slippage Passively
Curve Finance redefined stablecoin AMMs with its StableSwap invariant, a bold fusion of constant-sum and constant-product curves. Traditional constant-product models like Uniswap V2 explode slippage on pegged assets; constant-sum ignores price deviations. Curve blends them via a tunable parameter, A, amplifying the sum region for 1: 1 trades. Result? Laser-focused efficiency for stablecoin swaps.
Picture a $1 million USDC-to-USDT swap on Curve’s 3Pool: slippage clocks in at a mere 0.01%. This passive powerhouse thrives without LP micromanagement. Liquidity concentrates organically around the peg, fueled by veCRV incentives that lock capital deep into low-vol zones. No range rebalancing needed; the math handles volatility spikes autonomously.
Bold claim: For pure stablecoin volume, Curve’s design is mathematically superior in stableswap vs uniswap v3 battles. Sources echo this dominance, with Curve’s USDC/USDT pool capturing 75% of Uniswap’s volume using just one-eighth the liquidity. LPs rake in ~2.5% yields, turning idle stables into yield machines.
Curve Stableswap vs Uniswap V3: Slippage and Liquidity Efficiency for USDC-USDT Swaps
| Metric | Curve Stableswap | Uniswap V3 Concentrated Liquidity |
|---|---|---|
| Slippage ($1M USDC-USDT Swap) | 0.01% | 0.05-0.2% (in-range) |
| Management Required | Passive | Active (to maintain range) |
| Liquidity Efficiency | 75% Uniswap volume with 1/8 liquidity | Higher capital efficiency |
| Impermanent Loss Risk | Low | Higher (if unmanaged) |
| Optimized For | Stablecoin pairs near 1:1 peg | Concentrated positions with active mgmt |
Uniswap V3 Concentrated Liquidity: Capital Efficiency’s Double-Edged Sword
Uniswap V3 flipped the AMM script with concentrated liquidity stablecoin positions, letting LPs zoom capital into custom price ranges. For USDC-USDT, providers stack liquidity tightly around $1, say 0.999-1.001, skyrocketing efficiency 4000x over V2’s wild spreads. Slippage plummets when trades stay in-range; a well-positioned pool rivals Curve for small swaps.
But here’s the technical gut-punch: ranges demand vigilant management. Price nudges USDC to 1.001? Out-of-range liquidity ghosts, spiking slippage. Impermanent loss lurks if peg drifts, forcing LPs to harvest fees and reposition. Active strategies like CLAMM (from steer. finance) mitigate this, yet they add gas overhead and oracle risks.
Uniswap shines for dynamic pairs, but in stable AMM comparison, its stablecoin prowess falters without pro-level oversight. Dune analytics post-V3 reveal Curve retaining stablecoin throne, processing massive volumes with fractions of the capital.

Slippage Showdown: $1M USDC-USDT Trades Under the Microscope
Let’s crunch the numbers in a curve finance stableswap versus concentrated liquidity cage match. Curve’s hybrid curve yields that 0.01% slippage on $1M swaps, invariant holding firm across 99% of trades. Uniswap V3? Optimal in-range setups hit 0.05%, but real-world drift pushes it to 0.2% without tweaks. Steer. finance’s case study nails it: Curve’s passive edge wins for large, predictable flows.
Volume tells the tale. Curve’s stable pools dominate Ethereum’s top three stables post-Uniswap V3, per Dune’s StableSwap Wars. MEXC reports underscore Curve’s leverage: higher throughput, superior LP returns. Reddit’s r/defi threads buzz with converts ditching Uniswap for Curve’s set-it-and-forget-it reliability in low slippage USDC USDT hunts.
Technical deep dive: Curve’s amplification factor A scales liquidity density near peg, mathematically minimizing D invariant perturbations. Uniswap V3’s virtual liquidity multiplies via sqrt(P) ranges, potent yet brittle. For yield farmers, Curve’s CRV emissions compound the advantage, bootstrapping deeper pools without V3’s fee-tier fragmentation.
Empirical data from Coin Metrics and Dune cements Curve’s reign: post-V3, stablecoin DEX volumes tilted heavily toward Curve Finance Stableswap, with Ethereum’s top stables funneled through its pools. Uniswap V3 captured volatile pairs, but Curve’s low-slippage fortress held for USDC-USDT. Zealynx Security’s deep dive spotlights StableSwap’s invariant as the antidote to constant-product flaws, birthing crvUSD and beyond.
LP Yield Battle: Passive Rewards vs Active Grind
Liquidity providers face a stark fork: Curve’s veCRV flywheel or Uniswap’s fee hustle. In Curve, locking CRV as veCRV votes boost emissions to your pool, supercharging APYs in low-vol havens. That 2.5% baseline yield on USDC-USDT? It compounds with gauge weights, drawing billions in TVL passively. No range anxiety; the protocol’s amplification coefficient A dynamically densifies liquidity at peg.
Uniswap V3 tempts with 4000x capital multipliers, but stablecoin LPs grapple with impermanent loss on micro-drifts. A 0.1% peg wobble evaporates edge unless you automate via CLAMM protocols. Gas fees for rebalances erode small positions, favoring whales with bots. Reddit’s r/defi consensus? Curve for set-and-forget yields; V3 for exotic plays. Stablecoininsider. org ranks Curve tops for 2025 liquidity providers, citing its hyper-efficient design.
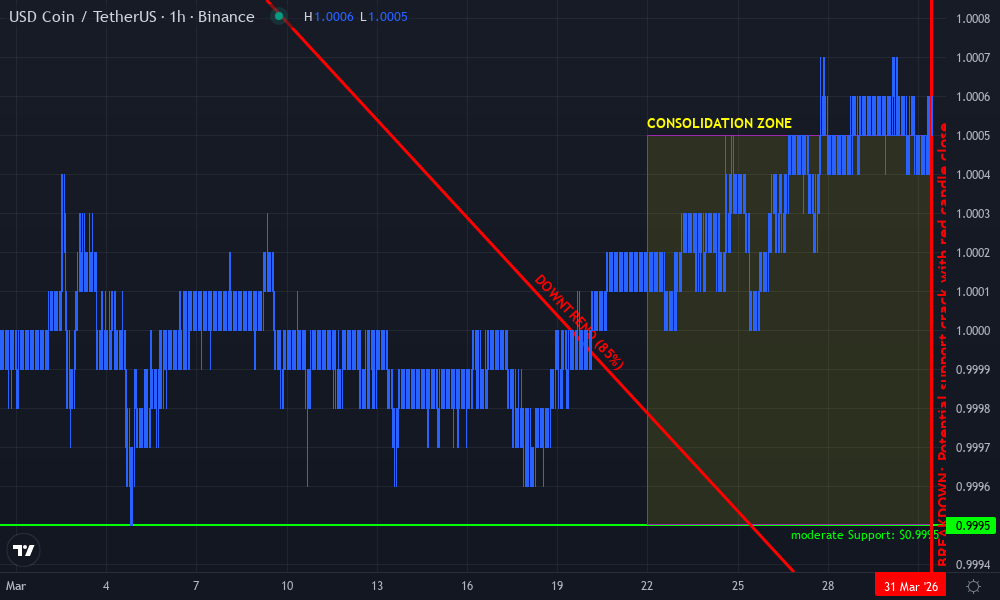
USDC / USDT Technical Analysis Chart
Analysis by Matthew Thompson | Symbol: BINANCE:USDCUSDT | Interval: 1h | Drawings: 6
Technical Analysis Summary
Aggressively mark the subtle downtrend channel squeezing USDC/USDT with a bold trend_line from the March 7 high at 1.0010 to the March 31 low at 0.9990, extending it forward for breakout targets. Layer horizontal_lines at prime support 0.9990 (strong) and resistance 1.0010 (breaking soon), plus a rectangle for the tight consolidation zone 0.9995-1.0005 from March 22-31. Drop arrow_mark_down on the MACD bearish cross near March 28, callout volume spikes on downside pushes, and short_position marker at 1.0000 entry with stop above 1.0015, target 0.9980. Fib_retracement from recent swing high-low for depeg potential. Vertical_line on March 31 potential breakdown.
Risk Assessment: medium
Analysis: Low vol stablecoin but volume divergence hints at depeg risk; Curve efficiency mitigates slippage for aggressive entries.
Matthew Thompson’s Recommendation: Short bias with high tolerance—scale in on 1.000 rejects targeting 0.998, trail stops for yield farm setups.
Key Support & Resistance Levels
📈 Support Levels:
-
$0.999 – Strong peg floor tested multiple times with volume support.
strong -
$1 – Minor intraday hold.
moderate
📉 Resistance Levels:
-
$1.001 – Key overhead cap rejecting upside repeatedly.
strong -
$1.001 – Weak interim resistance in consolidation.
weak
Trading Zones (high risk tolerance)
🎯 Entry Zones:
-
$1 – Aggressive short on resistance test with volume confirmation.
high risk -
$1 – Long scalp if support holds for quick bounce to 1.0005.
medium risk
🚪 Exit Zones:
-
$0.998 – Profit target on depeg continuation.
💰 profit target -
$1.002 – Tight stop above channel resistance.
🛡️ stop loss -
$1.001 – Profit on long bounce.
💰 profit target
Technical Indicators Analysis
📊 Volume Analysis:
Pattern: Increasing on downside candles, confirming bearish pressure.
Volume spikes align with lower lows, signaling distribution in low-vol setup.
📈 MACD Analysis:
Signal: Bearish crossover
MACD line dipped below signal mid-March 28, momentum turning south.
Applied TradingView Drawing Utilities
This chart analysis utilizes the following professional drawing tools:
Disclaimer: This technical analysis by Matthew Thompson is for educational purposes only and should not be considered as financial advice.
Trading involves risk, and you should always do your own research before making investment decisions.
Past performance does not guarantee future results. The analysis reflects the author’s personal methodology and risk tolerance (high).
Risk Radar: Protocol Vulnerabilities Exposed
No AMM is bulletproof. Curve battles smart contract exploits, like the 2023 Vyper hack draining pools, yet rapid fixes and insurance via Nexus Mutual restore faith. Its oracle-free design dodges manipulation, but CRV depegs introduce token risk. Uniswap V3? Sandwich attacks plague narrow ranges, and liquidity fragmentation across fee tiers dilutes depth. Cyfrin’s video breakdown reveals V3’s edge in flexibility but Curve’s resilience for concentrated liquidity stablecoin stress tests.
2026 context from steer. finance sharpens the lens: Curve’s 0.01% slippage on $1M swaps crushes V3’s 0.05-0.2% in unmanaged ranges. Active LPs mitigate via just-in-time liquidity, but that’s pro territory. For retail yield farmers, Curve’s passive armor trumps V3’s sword.
Hybrid tactics emerge: front-run large swaps on Curve, harvest V3 fees in tight ranges. Danial Safari’s Medium analysis positions Curve v2 as the generalist evolution, blending stable prowess with broader pairs, yet stables remain its killer app.
Curve’s USDC/USDT pool processes 75% of Uniswap volume with one-eighth the liquidity. LPs earn ~2.5% yields without breaking a sweat.
Trader Playbook: Alpha Extraction Strategies
Deploy Curve for mega-swaps exceeding $500K; its invariant shrugs off size. Small fries under $10K? V3’s precision shines if ranges align. Monitor Dune’s StableSwap Wars dashboard for real-time dominance shifts. Yield chasers: stack veCRV, vote 3Pool gauges, and watch APY spike during volatility lulls.
In stable AMM comparison, Curve’s math wins 9/10 for USDC-USDT. Uniswap V3 flexes for multi-asset pools, but peg purity favors StableSwap. StableswapHub. com dashboards live-compare these beasts, arming you with slippage simulators and yield optimizers. Forge your edge in low-vol trenches: passive for scale, concentrated for control.
DeFi evolves, but for low slippage USDC USDT supremacy, Curve’s hybrid invariant endures as the calculated aggressor’s weapon of choice.