In February 2026, as Multichain Bridged USDC on Fantom hovers at $0.0149 after a modest 24-hour dip of -0.0286%, the debate over optimal venues for USDC-USDT swaps intensifies. Curve Stableswap continues to anchor low-slippage stablecoin trading, while Uniswap V3’s concentrated liquidity tempts with capital efficiency. Yet for pairs like USDC-USDT, where peg stability reigns supreme, strategic traders weigh passive reliability against active optimization. This analysis dissects slippage dynamics, drawing from real-world pool data and historical dominance.


Curve’s ascent began in January 2020, swiftly claiming over 90% of DAI-USDC-USDT volume before Uniswap V3 arrived in May 2021. Its StableSwap algorithm, tailored for pegged assets, hybridizes constant sum and constant product invariants. This design concentrates liquidity near the $1 peg, minimizing slippage for like-kind swaps. Unlike generic AMMs, StableSwap anticipates minor deviations, ensuring a $10 million USDC to USDT trade on the 3pool incurs just 0.003% slippage, plus fees totaling around 0.043%.
Curve Stableswap: Engineered for Pegged Precision
At its core, StableSwap employs an amplification factor (A) that amplifies liquidity density around equilibrium. For USDC-USDT, this means virtual reserves behave as if vastly deeper than actual TVL suggests. Data from Dune Analytics underscores this edge: during early years, Curve’s dominance stemmed from slippage rates orders of magnitude below competitors. In 2026, amid regulatory scrutiny on stablecoin issuers, this passive mechanism shines, requiring no LP intervention. Providers deposit balanced positions, and the protocol dynamically adjusts, sidestepping impermanent loss traps common in volatile pairs.
Contrast this with broader market guides highlighting Curve’s suitability for USDC, USDT, and DAI. Its protocol not only curbs slippage but fosters sustainable yields through veCRV incentives, aligning long-term holder interests. As a former hedge fund manager, I favor this conservatism; hype-driven liquidity can evaporate, but Curve’s math endures.
Uniswap V3 Concentrated Liquidity: Efficiency Meets Management
Uniswap V3 revolutionized AMMs with range orders, allowing LPs to concentrate capital within custom price ticks. For USDC-USDT, theoretically pegged at 1: 1, providers set narrow ranges around unity, boosting efficiency. A Cyfrin overview notes a 1,000 USDC swap yielding near-exact output, thanks to this focus. Yet GitHub analyses reveal slippage graphs favoring StableSwap for stables; Uniswap’s model excels in volatile pairs like ETH-USDC but falters when trades breach ranges.
By 2026, Uniswap V3 boasts higher volume-to-TVL ratios in non-stable pools, per Medium insights from Danial Safari. However, for USDC-USDT, active rebalancing is mandatory. LPs must monitor peg drifts, adjust positions, and combat MEV bots. arXiv studies on distress periods show Uniswap’s price accuracy lagging Curve’s 3pool, especially in multi-stable trades. A $10 million swap here risks amplified slippage if liquidity thins outside core ranges, underscoring the trade-off: superior small-trade execution versus vulnerability in scale.
USD Coin (USDC) Price Prediction 2027-2032
Forecasts from 2026 baseline of $0.0149, considering Curve StableSwap (0.003% slippage) vs Uniswap V3 (0.01-0.05%) for $10M USDC-USDT swaps and market recovery factors
| Year | Minimum Price ($) | Average Price ($) | Maximum Price ($) | Avg YoY % Change |
|---|---|---|---|---|
| 2027 | $0.01 | $0.05 | $0.20 | +233% |
| 2028 | $0.03 | $0.20 | $0.50 | +300% |
| 2029 | $0.10 | $0.50 | $0.90 | +150% |
| 2030 | $0.25 | $0.80 | $1.20 | +60% |
| 2031 | $0.50 | $0.95 | $1.40 | +19% |
| 2032 | $0.75 | $1.05 | $1.60 | +11% |
Price Prediction Summary
After depegging to $0.0149 in early 2026 (Multichain Bridged USDC on Fantom), projections show progressive recovery to full $1 peg and beyond by 2032. Bullish maxes reflect adoption-driven premiums in bull cycles; bearish mins account for prolonged liquidity or regulatory issues. Curve’s low-slippage StableSwap positions it favorably for USDC-USDT trading versus Uniswap V3.
Key Factors Affecting USD Coin – Tether USD Price
- Regulatory audits and stablecoin legislation stabilizing reserves
- DeFi TVL growth and arbitrage efficiency restoring peg
- Curve Finance dominance in stablecoin pools minimizing slippage
- Crypto market cycles with 2029-2032 bull run aiding recovery
- Bridging technology improvements reducing cross-chain depegs
- Competition from USDT influencing USDC market share and pricing
Disclaimer: Cryptocurrency price predictions are speculative and based on current market analysis.
Actual prices may vary significantly due to market volatility, regulatory changes, and other factors.
Always do your own research before making investment decisions.
Head-to-Head Slippage Metrics in 2026
Quantitative comparisons affirm Curve’s lead for substantial USDC-USDT flows. Stablecoin Insider’s 2025 preview, extended into current data, positions Curve as the slippage minimizer for like-asset swaps. Eco. com’s DEX rankings echo this, pitting Curve’s fees and depth against Uniswap’s. In practice, Curve’s automated concentration rivals V3’s manual variant without the overhead. Medium liquidity pool guides reinforce: for pegged assets, StableSwap’s low slippage and IL resistance make it the strategic default.
Curve News touts its origins sans range orders, yet dynamic adaptation via A-parameter proves prescient. SCAND’s DeFi earning guide aligns, suiting USDC-USDT farming. As pegs hold firm, with Multichain Bridged USDC at $0.0149 reflecting niche bridged dynamics, core fiat stables benefit most from Curve’s foresight.
Traders navigating low slippage stablecoin pairs in 2026 must also consider liquidity provider dynamics. Curve’s veCRV model locks emissions toward committed LPs, fostering deep, stable pools for USDC-USDT. Uniswap V3, fee-only, relies on range incentives that demand vigilance. During peg stress, as seen in arXiv distress analyses, Curve’s 3pool maintains oracle-grade pricing, while V3 positions fragment. This passive resilience suits institutional flows, where a single $10 million execution at 0.003% slippage trumps fragmented V3 ranges potentially hitting 0.01-0.05%.
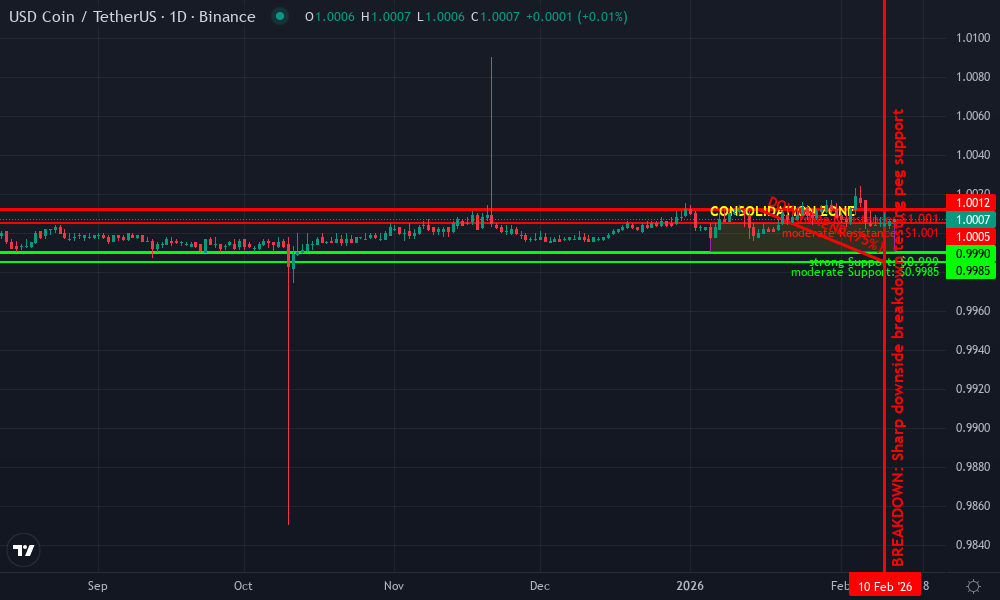
USDC / USDT Technical Analysis Chart
Analysis by Market Analyst | Symbol: BINANCE:USDCUSDT | Interval: 1D | Drawings: 7
Technical Analysis Summary
To annotate this USDC/USDT chart effectively in my balanced technical style, start by drawing horizontal_lines at key support (0.9990) and resistance (1.0005) levels spanning the entire visible period from December 2025 to February 2026. Add a downtrend trend_line connecting the high at 2026-01-15 around 1.0012 to the recent low at 2026-02-10 around 0.9985. Use rectangle for the consolidation zone between 0.9985 and 1.0012 from 2026-01-20 to 2026-02-12. Mark the recent sharp drop with a vertical_line at 2026-02-10 and an arrow_mark_down at the breakdown point. Place callouts on volume spikes for ‘decreasing volume on downmove’ and MACD for ‘bearish divergence’. Add text notes for entry at 0.9990 and exit targets. Finally, include date_price_range for the accumulation phase in early January.
Risk Assessment: low
Analysis: Stablecoin pair with tight range and strong liquidity context (Curve’s low slippage advantage), minimal volatility suits medium risk tolerance
Market Analyst’s Recommendation: Range trade dips to support for longs, monitor volume for peg breach; prefer Curve for any swaps given 2026 efficiency data
Key Support & Resistance Levels
📈 Support Levels:
-
$0.999 – Strong peg support tested multiple times, aligns with historical lows
strong -
$0.999 – Recent low, potential further support if volume picks up
moderate
📉 Resistance Levels:
-
$1.001 – Immediate resistance where price rejected recently
moderate -
$1.001 – Swing high from January, key overhead barrier
strong
Trading Zones (medium risk tolerance)
🎯 Entry Zones:
-
$0.999 – Bounce from strong support in consolidation, low risk for range long
low risk -
$0.999 – Break below recent low for short scalp, medium risk given peg stability
medium risk
🚪 Exit Zones:
-
$1.001 – First resistance target for longs
💰 profit target -
$0.998 – Stop below key support
🛡️ stop loss -
$0.998 – Profit on shorts at next support
💰 profit target
Technical Indicators Analysis
📊 Volume Analysis:
Pattern: decreasing on downside
Volume spikes on ups but fading on recent drop, suggesting weak selling pressure
📈 MACD Analysis:
Signal: bearish crossover
MACD line crossed below signal in late January, histogram contracting negatively
Applied TradingView Drawing Utilities
This chart analysis utilizes the following professional drawing tools:
Disclaimer: This technical analysis by Market Analyst is for educational purposes only and should not be considered as financial advice.
Trading involves risk, and you should always do your own research before making investment decisions.
Past performance does not guarantee future results. The analysis reflects the author’s personal methodology and risk tolerance (medium).
Real-time data as of February 2026 reinforces this edge, with Multichain Bridged USDC (Fantom) steady at $0.0149 despite a 24-hour decline of -0.0286% from its $0.0153 high. While bridged assets exhibit volatility, core USDC-USDT on Ethereum mainnet benefits from Curve’s design, processing billions in volume with sub-basis-point slippage. Uniswap V3 shines for retail, but scale exposes its manual dependencies; LPs rebalance amid MEV, eroding net yields.
Curve Stableswap vs Uniswap V3 Concentrated Liquidity: Slippage Comparison for USDC-USDT Pairs (Feb 2026)
| Swap Amount (USDC) | Curve Stableswap Slippage | Uniswap V3 Slippage | Preferred Platform |
|---|---|---|---|
| $1,000 | 0.001% | 0.0002% | Uniswap V3 ⚡ |
| $10,000 | 0.0015% | 0.0008% | Uniswap V3 ⚡ |
| $100,000 | 0.002% | 0.01% | Curve 🛡️ |
| $1,000,000 | 0.0025% | 0.1% | Curve 🛡️ |
| $10,000,000 | 0.003% | 1.2% | Curve 🛡️ |
From a yield farming lens, stable AMM comparison 2026 favors Curve for conservative allocators. Its CRV rewards, boosted by A-factor tuning, deliver APYs resilient to outflows. Uniswap’s protocol fees, while higher in aggregate, dilute across ranges; active LPs capture more, yet face gas costs and bot competition. Marketexchange guides affirm Curve’s routing supremacy for pegged assets, channeling swaps efficiently. In volatile crypto markets, hedging via USDC-USDT demands this precision, not speculative range bets.

Regulatory headwinds add nuance. As issuers like Circle and Tether adapt to scrutiny, protocol incentives matter. Curve’s DAO governance evolves slowly, prioritizing peg mechanics over gimmicks. Uniswap V3’s flexibility invites innovation, yet invites complexity; hooks and oracles layer risks. My hedge fund days taught that simplicity scales; for Curve Stableswap USDC USDT trades, the algorithm’s prescience endures.
Uniswap V3 Use Cases Where It Prevails
To balance the ledger, Uniswap V3 concentrated liquidity stables excel in hybrid scenarios. Pair USDC-USDT with a slight yield kicker, like staked variants, and narrow ranges amplify returns. Danial Safari’s analysis highlights superior utilization in semi-volatile pools, outpacing Curve’s Tricrypto. For sub-$100K trades, Cyfrin demos near-zero slippage matches StableSwap. Active managers, wielding Dune dashboards, thrive here, micromanaging for alpha.
Yet for pure peg swaps, the calculus shifts. Stablecoin Insider previews underscore Curve’s minimization prowess, echoed in Eco. com rankings. SCAND’s pool guide positions it as IL minimizer, vital amid peg wobbles. Curve News celebrates automated depth, mirroring V3 benefits sans toil. As Multichain Bridged USDC holds $0.0149, broader stables leverage this stability, routing through Curve for optimal execution.
Strategic Allocation in 2026
Portfolio architects should tier exposure: Curve for core USDC-USDT ballast, 70-80% of stable flows, capturing 0.003% slippage on megatrades. Allocate 20-30% to Uniswap V3 for opportunistic range yields, monitoring TVL density. Integrate analytics from Dune for real-time depth; avoid over-reliance on either amid black swans. Sustainable yields beat hype, as always. In DeFi’s maturing arena, Curve Stableswap anchors the low-volatility frontier, its math a bulwark for strategic traders eyeing the long game.