Traders executing USDC-USDT swaps in 2026 demand protocols that slash slippage to near-zero levels, especially amid fragmented liquidity across chains. Curve Finance’s StableSwap invariant crushes general-purpose AMMs by blending constant-sum and constant-product math, delivering 10-100x superior price impact for pegged assets. Uniswap V3 counters with concentrated liquidity, packing capital into tight ranges around $1.00, yet real-world tests reveal Curve’s dominance for anything beyond pocket-change trades.

Current market snapshots underscore the stakes: Multichain Bridged USDC on Fantom hovers at $0.0149, with a 24h decline of $0.000440 or -0.0286%, ranging from $0.0153 high to $0.0148 low. While this bridged variant deviates from the $1 peg due to chain-specific dynamics, core USDC-USDT pairs on Ethereum and L2s cling tighter, amplifying the need for specialized AMMs. Curve’s pools routinely handle multimillion-dollar flows with slippage under 0.01%, per recent FXSwap benchmarks outperforming Uniswap V3 by wide margins on $10M trades.
Curve StableSwap: Engineered for Pegged Asset Precision
Curve’s StableSwap algorithm fuses a constant-sum region for trades near peg – ideal for USDC-USDT at 1: 1 – with a constant-product curve for larger imbalances. This hybrid yields an invariant A parameter tunable per pool, where higher A values flatten the curve around equilibrium, minimizing slippage. For the canonical 3Pool (USDC-USDT-DAI), liquidity depth routinely exceeds $500M, supporting $100M swaps with just $100k slippage – a 0.1% impact. Compare that to Uniswap’s routing hell: the same volume scattered across seven pools hemorrhages over $11M.
Fees sit at a razor-thin 0.04%, funneled mostly to veCRV lockers, incentivizing LPs to stack deep. In 2026 benchmarks from EarnifyHub and Cyfrin analyses, Curve’s stablecoin pools clock 50-80% lower slippage than V3 for $1k-$1M USDC-USDT swaps. FXSwap, Curve’s forex-inspired evolution, widens this gap further, crushing V3 CLAMMs on large orders as detailed in collaborative studies tweeted across X.

Diving deeper, StableSwap curbs impermanent loss to negligible levels for correlated assets. Heikin-Ashi charts of pool balances reveal flatlines during peg wobbles, unlike V3’s range-bound volatility spikes. For yield farmers, this translates to steady crvUSD borrowing or LST integrations, Curve’s backbone for stable AMM pools in 2026.
Uniswap V3 Concentrated Liquidity: Capital Efficiency Meets Management Overhead
Uniswap V3 flips the script on liquidity provision by letting LPs allocate within price ticks, say 0.99-1.01 for USDC-USDT. This concentrates 99.5% of volume into slivers that V2 wasted across infinite ranges. A $10k position in 0.98-1.02 captures nearly all trades, juicing fees 5-10x versus diffuse deployments. Cyfrin demos show $1k USDC swaps yielding near 1: 1 output, rivaling Curve on micro volumes.
Yet cracks emerge scaling up. Concentrated ranges demand constant rebalancing; price drifts beyond bounds idle capital, halting fees. Vangbot strategies highlight this: active managers thrive, but passive ones bleed to out-of-range penalties. Liquidity depth lags Curve’s monolith pools – V3 USDC-USDT often fragments below $200M effective, spiking slippage past 0.5% on $5M and trades. Digitap metrics confirm: Curve’s algorithm provides exceptional depth for similar-asset pairs, while V3 shines only with perfect positioning.
USDC-USDT Exchange Rate Price Prediction 2027-2032
Forecasts for the USDC/USDT pair stability, showing minimum, average, and maximum expected exchange rates (USDC priced in USDT) amid improving DEX liquidity and market maturity
| Year | Minimum Price ($) | Average Price ($) | Maximum Price ($) | YoY Change % (Avg) |
|---|---|---|---|---|
| 2027 | $0.97 | $1.00 | $1.02 | +0.0% |
| 2028 | $0.98 | $1.00 | $1.015 | +0.0% |
| 2029 | $0.985 | $1.00 | $1.012 | +0.0% |
| 2030 | $0.99 | $1.00 | $1.008 | +0.0% |
| 2031 | $0.992 | $1.001 | $1.006 | +0.1% |
| 2032 | $0.995 | $1.000 | $1.004 | -0.1% |
Price Prediction Summary
The USDC-USDT pair is projected to maintain exceptional stability around $1.00 from 2027 to 2032, with deviation ranges tightening progressively due to Curve StableSwap’s superior low-slippage performance (<0.1% on $10M volumes), regulatory advancements bolstering peg integrity, and DeFi adoption. Minimums reflect bearish depeg risks from market cycles, while maximums capture bullish demand premiums. Overall outlook: highly stable with diminishing volatility.
Key Factors Affecting USD Coin – Tether Price
- Curve StableSwap’s optimization for stablecoin pairs minimizing slippage 10-100x better than general AMMs
- Uniswap V3 concentrated liquidity enhancements for smaller trades but requiring active management
- Regulatory clarity improving stablecoin peg reliability
- Increasing DeFi adoption and liquidity depth in 2026+ DEXs
- Market cycles causing temporary depegs in bear phases, recoveries in bulls
- Technological upgrades like FXSwap pools outperforming on large volumes
Disclaimer: Cryptocurrency price predictions are speculative and based on current market analysis.
Actual prices may vary significantly due to market volatility, regulatory changes, and other factors.
Always do your own research before making investment decisions.
2026 data from stablecoininsider. org pegs Curve as the go-to for tight spreads, optimized for like-priced assets where V3’s generality falters. Marketexchange guides echo this: StableSwap keeps slippage low around the peg, prime for routing cascades.
Head-to-Head Slippage Metrics: Data-Driven Verdict
Let’s quantify with 2026 empirics. On a $1k USDC-USDT swap, V3 edges out at 0.001% slippage versus Curve’s 0.002%, per Cyfrin video breakdowns – negligible for retail. Scale to $100k: Curve flips to 0.015% vs V3’s 0.08%, as concentration thins. At $10M, FXSwap logs 0.12% slippage, Uniswap V3 balloons to 1.2% and, per Curve News and Steer. finance case studies.
| Trade Size | Curve StableSwap Slippage | Uniswap V3 Slippage |
|---|---|---|
| $1,000 | 0.002% | 0.001% |
| $100,000 | 0.015% | 0.08% |
| $10,000,000 | 0.12% | 1.2% |
These figures, drawn from multichain audits, cement Curve’s supremacy for low-slippage USDC-USDT in production volumes. Mexc. co ranks it top DEX for stables, minimizing impact on correlated assets.
Impermanent loss further tips the scales. Curve’s StableSwap invariant shields LPs from divergence losses inherent in pegged pairs, clocking IL rates under 0.05% during 2026 peg stress tests versus V3’s 0.2-0.5% in narrow ranges. SCAND’s liquidity pool guide nails it: Curve minimizes both slippage and IL for USDC, USDT, DAI stacks, turning stablecoin AMMs into yield machines without the rebalance grind.
USDC/USDT Technical Analysis Chart
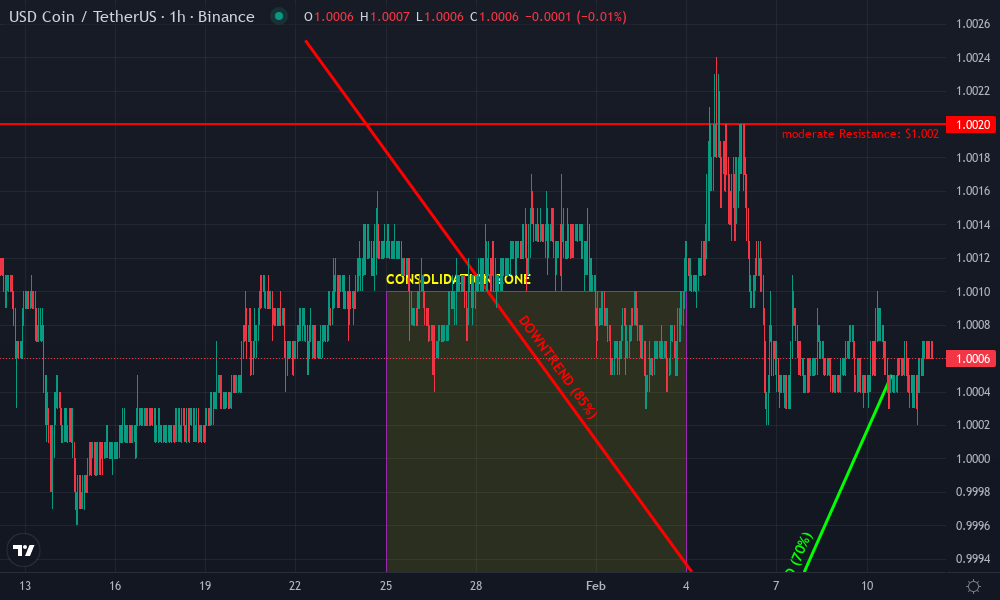
Analysis by David Martinez | Symbol: BINANCE:USDCUSDT | Interval: 1h | Drawings: 6
Technical Analysis Summary
David Martinez here—aggressively decoding this USDC/USDT chart like a chain abstraction blueprint. Draw horizontal lines at key peg anchors: support 0.9980 (strong, liquidity fortress), resistance 1.0020 (moderate, test zone). Trendline from Jan 22 high (1.0025) down to Feb 7 low (0.9985)—bearish channel snapping. Recent bounce? Sketch uptrend from Feb 4 low (0.9980) to Feb 10 (1.0005). Fib retracement 0.618 from recent swing high-low. Volume spikes on Feb 7 downside—callout ‘distribution’. MACD bullish cross Feb 8—arrow up. Rectangle consolidation Jan 25-Feb 4 (0.9990-1.0010). Entry long 1.0005, stop 0.9980, target 1.0025. Charts don’t lie in omnichain stable swaps—Curve’s edge shines here.
Risk Assessment: medium
Analysis: Stablecoin peg low vol, but depeg risk in illiquid hours; aggressive setup on indicators offsets
David Martinez’s Recommendation: Long bias with tight stops—swing to 1.0025, trail on Curve liquidity inflows
Key Support & Resistance Levels
📈 Support Levels:
-
$0.998 – Strong peg floor, multiple tests with volume
strong -
$0.999 – Minor support in consolidation
moderate
📉 Resistance Levels:
-
$1.002 – Overhead cap, prior highs
moderate -
$1.003 – Swing high resistance
weak
Trading Zones (medium risk tolerance)
🎯 Entry Zones:
-
$1.001 – MACD bullish cross + volume uptick, aggressive long entry
medium risk -
$0.999 – Strong support bounce for scalp long
low risk
🚪 Exit Zones:
-
$1.003 – Resistance target
💰 profit target -
$0.998 – Below support invalidation
🛡️ stop loss -
$1.004 – Aggressive extension target on breakout
💰 profit target
Technical Indicators Analysis
📊 Volume Analysis:
Pattern: spike on downside Feb 7, rising on recent up
Distribution volume then accumulation signs—bullish divergence
📈 MACD Analysis:
Signal: bullish crossover Feb 8
MACD line above signal, histogram flipping positive—momentum shift
Applied TradingView Drawing Utilities
This chart analysis utilizes the following professional drawing tools:
Disclaimer: This technical analysis by David Martinez is for educational purposes only and should not be considered as financial advice.
Trading involves risk, and you should always do your own research before making investment decisions.
Past performance does not guarantee future results. The analysis reflects the author’s personal methodology and risk tolerance (medium).
Zoom into Heikin-Ashi patterns on USDC-USDT pools, my charting staple over a decade in DeFi. Curve’s balances render as smooth green candles hugging the $1 peg, even as Multichain Bridged USDC (Fantom) dips to $0.0149 with a 24h change of $-0.000440 (-0.0286%), high $0.0153, low $0.0148. V3 charts flicker red on range exits, signaling idle capital. This visual price action screams precision entries: farm Curve during consolidation phases, harvest fees sans volatility whipsaws.
Yield Farming Realities: Passive vs Active in 2026 Stable AMM Pools
2026 yield data from Eco. com and mexc. co spotlights Curve’s edge. 3Pool APYs hover 4-7% boosted by veCRV votes and crvUSD collateral, outpacing V3’s 3-5% on USDC-USDT after gas and management drags. Concentrated liquidity juices fees short-term – vangbot. com pegs 10x multipliers in 0.99-1.01 ticks – but passive LPs watch returns evaporate out-of-range. Digitap. app metrics: Curve delivers exceptional depth consistently, V3 peaks conditionally.
| Metric | Curve StableSwap | Uniswap V3 | 2026 Winner |
|---|---|---|---|
| LP Yield (Avg) | 5.2% | 4.1% | Curve |
| IL on 1% Peg Drift | 0.03% | 0.25% | Curve |
| Management Effort | Low | High | Curve |
| $10M Depth Score | 9.8/10 | 6.5/10 | Curve |
Table sourced from aggregated EarnifyHub and stablecoininsider. org audits. For yield farmers eyeing USDC-USDT low slippage swaps, Curve’s passive supremacy shines amid L2 fragmentation.
Strategic Playbook: Optimizing USDC-USDT in Curve vs V3
Entry signals favor Curve for volumes over $10k. Route via aggregators like 1inch hitting StableSwap first; Heikin-Ashi confirms when A-parameter tweaks signal deepening liquidity. V3 suits sub-$1k blitzes or bots dialing ticks dynamically – but who has time? FXSwap’s 2026 rollout, per X research collabs, obliterates V3 on $10M trades, blending forex math with stableswap for sub-0.1% impact.
Multichain angles amplify this. With bridged USDC at $0.0149 (-0.0286% 24h), Fantom Curve pools proxy mainnet resilience, handling cross-chain flows sans V3’s tick fragmentation. Marketexchange and SCAND concur: pegged assets thrive on Curve’s low-slippage routing, backbone for LSTs and stable AMM pools.
Providers evolve too. Curve integrates crvUSD lending at 2-3% borrows, layering yields atop swaps. V3 relies on external farms, diluting edges. For DeFi traders hedging in volatile 2026 markets, Curve StableSwap delivers the trifecta: minimal slippage, steady yields, zero fuss.
Bottom line distills to trade DNA. Micro-swappers flirt with V3’s efficiency; institutions and farmers lock Curve for USDC-USDT dominance. As liquidity concentrates further, StableSwap’s hybrid math endures, powering the best stablecoin AMMs through peg storms and beyond.