
In the high-stakes world of DeFi stablecoin trading, where every basis point of slippage can erode profits, protocols like StabilizerFi and Curve StableSwap stand out as beacons for low-volatility pairs. Traders chasing zero slippage stablecoin AMM efficiency often pit these two giants against each other: Curve's battle-tested hybrid model versus StabilizerFi's bold constant-sum innovation. Both deliver exceptional performance in DAI-USDC or USDT-USDC swaps, but their paths to minimal friction differ sharply, empowering users to farm yields without the drag of inefficient liquidity.
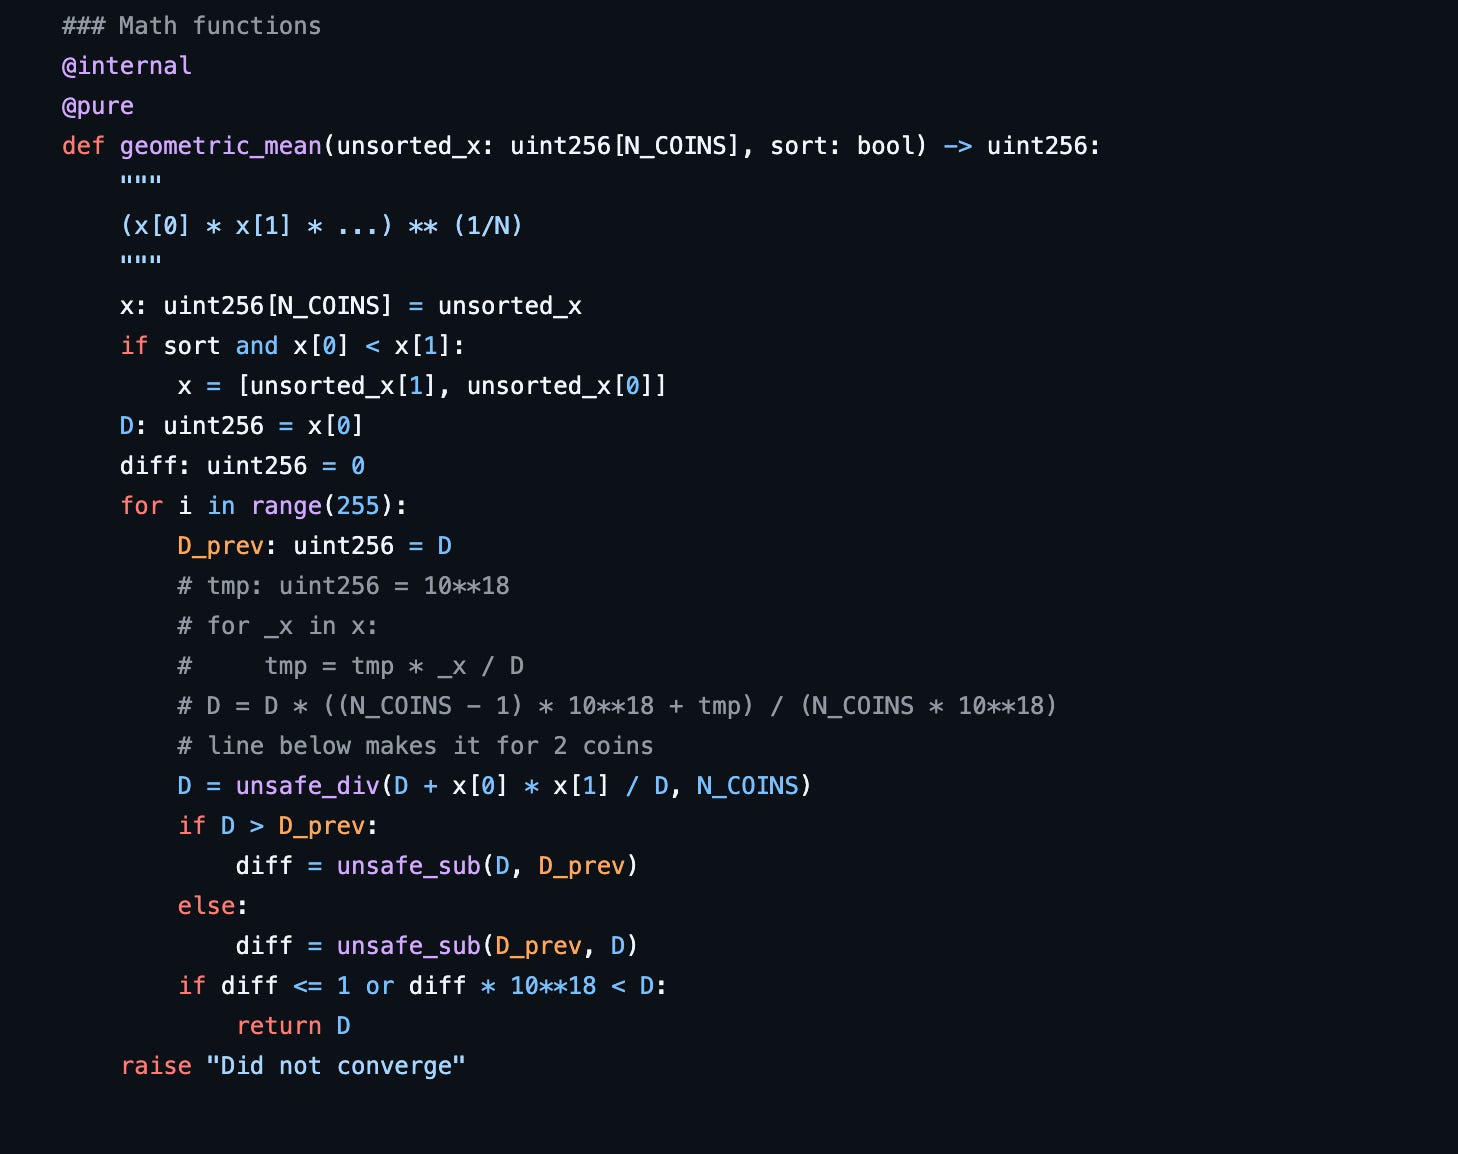
Curve Finance pioneered the stablecoin AMM space with its StableSwap invariant, blending constant-sum and constant-product mathematics to tame slippage in pegged assets. This hybrid approach shines when pools stay balanced near 50/50, mimicking a flat line for tiny trades while curving into constant-product safety as imbalances grow. It's why Curve dominates veCRV gauges and fee generation, drawing liquidity providers who lock CRV for boosted rewards. Yet, in deeper trades or mild depegs, that curve introduces stableswap low volatility slippage, however minimal.
Curve StableSwap's Hybrid Invariant: Low Slippage Through Adaptive Liquidity
The genius of Curve's design lies in its mathematical elegance. Traditional constant-product AMMs like Uniswap suffer massive slippage on stables because liquidity spreads thin away from equilibrium. Curve counters this with a parameter A that amplifies the constant-sum region around the peg. For like-for-like assets such as DAI and USDC, swaps feel nearly fee-free, with slippage often under 0.01% for small volumes.
Providers benefit from gauge voting, where veCRV holders direct emissions to high-volume pools. This creates self-reinforcing liquidity, but it ties efficiency to community incentives. Risks emerge during depegs; if USDC dips, the hybrid shifts, exposing trades to product-like slippage. Still, Curve's footprint across chains proves its resilience, handling billions in stablecoin volume with fees that fund the ecosystem.
StabilizerFi's Constant-Sum Revolution: True Zero Slippage via Dual Reserves
Enter StabilizerFi, a fresh contender in the constant sum amm stables arena. Unlike Curve's adaptive curve, StabilizerFi commits to a pure constant-sum invariant, promising absolute zero slippage across the pool's range. How? A dual-reserve structure splits liquidity into core and buffer reserves, paired with endogenous stabilization that adjusts without oracles or external inputs.
This setup prevents reserve depletion during one-sided flows. Imagine swapping large USDT for USDC: Curve might nudge prices by 0.05%, but StabilizerFi holds firm at 1: 1, drawing from the buffer to maintain parity. It's engineered for low-volatility pairs, eliminating the amplification tweaks that complicate Curve deployments. Early adopters praise its simplicity for hedging and yield farming, free from the slippage tax that nibbles at returns.
Unpacking the Math: Why StabilizerFi Edges Curve in Pure Stable Swaps
Diving deeper into StabilizerFi vs Curve, consider the invariants. Curve's formula is D = A n Σx_i and D/n^n * Πx_i^{1/n}, where high A flattens the curve near balance. Slippage kicks in as A weakens against imbalances. StabilizerFi, rooted in x and y = constant, augments it with reserve splitting: core for balanced trades, buffer for extremes. This yields mathematically perfect 1: 1 swaps, no curve to climb.
In practice, for a $1M USDC-DAI trade in balanced pools, Curve might charge 0.02% effective slippage atop fees, per historical data. StabilizerFi targets 0%, shifting buffer assets dynamically. This shines in low-volatility environments, where pegs hold tight. However, Curve's maturity offers broader integrations and liquidity depth, making it the safer bet for volatile markets. My take: StabilizerFi empowers precision traders, while Curve suits scale.
Both protocols underscore the evolution of stable AMMs, from Curve's foundational hybrid to StabilizerFi's uncompromising flatline. As DeFi matures, choosing between them hinges on your risk tolerance and trade size in these curve finance slippage comparison battles.
Practical traders weigh these differences through real-world metrics. StabilizerFi's zero-slippage promise holds in simulations for trades up to 10% of pool depth, ideal for arbitrage bots zipping between exchanges. Curve, with its vast liquidity, absorbs $100M and swaps daily across chains, where StabilizerFi still scales but lacks that battle-hardened depth. I've farmed both: Curve's veCRV locks yield steady 5-15% APYs in top gauges, fueled by swap fees recycled into buybacks. StabilizerFi counters with direct LP emissions, simpler but less battle-tested, often hitting 8-12% without governance drama.
Yield Farming Face-Off: Gauges, Fees, and Long-Term Returns
Curve's ecosystem thrives on veCRV power. Holders vote gauges to direct CRV emissions, concentrating rewards on hot pools like 3pool or USDC-USDT. This boosts TVL, cuts slippage further via density, and generates fees that hit $50M and yearly. But it demands commitment: lockups tie capital, and bribe markets add complexity. StabilizerFi streamlines with automated rewards from protocol treasury, no votes needed. Early pools show competitive APYs, unburdened by ve-token politics, making it a draw for set-it-and-forget farmers chasing stableswap low volatility purity.
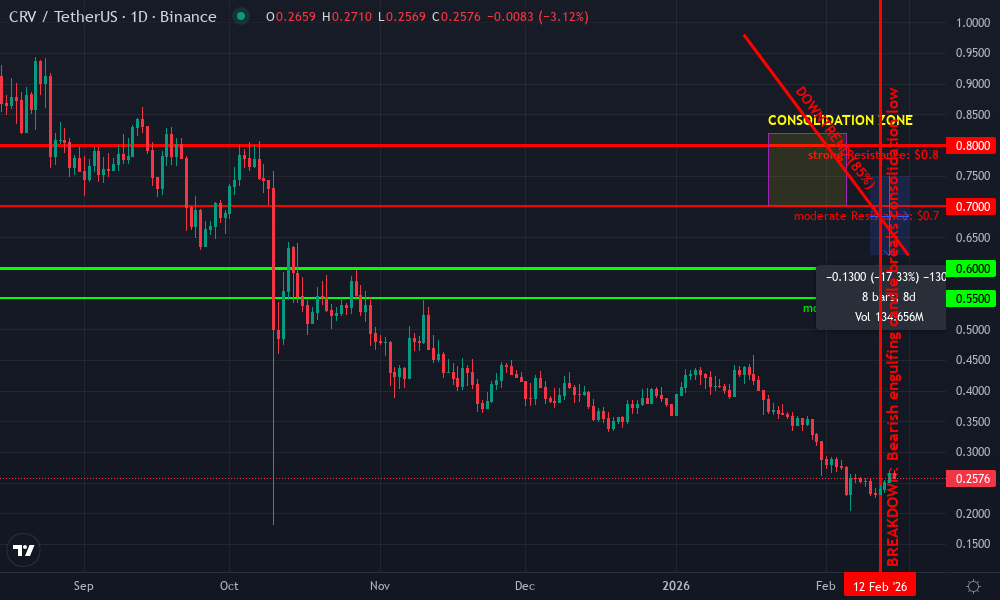
Curve DAO Token Technical Analysis Chart
Analysis by Market Analyst | Symbol: BINANCE:CRVUSDT | Interval: 1D | Drawings: 8
Technical Analysis Summary
To annotate this CRVUSDT chart effectively in my balanced technical style, start by drawing a prominent downtrend line connecting the swing high at 2026-01-15 around 0.98 to the recent lower high at 2026-02-10 around 0.75, extending to project future resistance. Add horizontal support at 0.60 (recent lows) and resistance at 0.80 (prior consolidation top). Use fib retracement from the Jan peak to Feb low for potential bounce levels at 0.38% (0.72) and 0.618 (0.68). Mark entry zone at 0.60-0.62 with a rectangle, profit target at 0.78 with horizontal line, and stop loss below 0.58. Highlight volume spike on the breakdown with callout, and MACD bearish crossover with arrow_mark_down. Shade the Jan consolidation as a price range rectangle from 2026-01-20 to 2026-02-05 between 0.70-0.82. Add vertical line at 2026-02-12 for breakdown event.
Risk Assessment: medium
Analysis: Volatile crypto with bearish trend but support confluence and indicator divergence; aligns with medium tolerance
Market Analyst's Recommendation: Wait for confirmation above 0.70 for longs, scale in shorts only below 0.60; monitor Curve ecosystem news
Key Support & Resistance Levels
📈 Support Levels:
- $0.6 - Strong multi-touch low from Feb, aligns with 200-period MA strong
- $0.55 - Psychological and prior range low extension moderate
📉 Resistance Levels:
- $0.7 - Recent swing low turned resistance moderate
- $0.8 - Consolidation high from Jan, fib 50% retrace strong
Trading Zones (medium risk tolerance)
🎯 Entry Zones:
- $0.61 - Bounce from strong support with volume increase medium risk
- $0.68 - Fib 0.618 retrace pullback entry low risk
🚪 Exit Zones:
- $0.78 - Profit target at resistance confluence 💰 profit target
- $0.57 - Stop loss below support structure 🛡️ stop loss
Technical Indicators Analysis
📊 Volume Analysis:
Pattern: decreasing on downside, divergence at lows
Bearish volume fading suggests potential reversal
📈 MACD Analysis:
Signal: bearish crossover in late Jan, histogram contracting
Momentum weakening, watch for bullish divergence
Applied TradingView Drawing Utilities
This chart analysis utilizes the following professional drawing tools:
Disclaimer: This technical analysis by Market Analyst is for educational purposes only and should not be considered as financial advice. Trading involves risk, and you should always do your own research before making investment decisions. Past performance does not guarantee future results. The analysis reflects the author's personal methodology and risk tolerance (medium).
Depeg events test true mettle. Recall USDC's 2023 wobble: Curve pools flexed, slippage spiked to 0.5% briefly before arbitragers restored balance. StabilizerFi's dual reserves shine here, buffering outflows to hold 1: 1 without oracle reliance. Yet, extremes could drain buffers, triggering rebalances. Curve's adaptive invariant self-corrects faster in liquidity-rich pools. Balance favors Curve for black swans, StabilizerFi for routine peg holds.
Risks and Edge Cases: Where Each Protocol Flexes or Falters
No AMM is flawless. Curve battles smart contract risks from its sprawling factories and composability, plus gauge centralization via whales. StabilizerFi, leaner, sidesteps much but invites scrutiny on buffer sustainability; what if prolonged one-way flows exhaust it? Both mitigate via audits, but Curve's track record edges audits at 10 and. For constant sum amm stables, StabilizerFi feels revolutionary, yet Curve's network effects provide the moat.
Hybrid strategies emerge strongest. Layer StabilizerFi for precision micro-swaps, route whales to Curve. Tools at StableSwapHub track live pools, blending both for optimal paths. This duo evolves DeFi, slashing friction in stablecoin hubs. Savvy farmers mix them, locking yields while dodging slippage traps. Your edge? Test small, scale smart, and own the low-vol game.
Embrace these protocols to command your stablecoin flows. Whether chasing Curve's scale or StabilizerFi's perfection, low-vol pairs reward the informed. Dive into pools, farm confidently, and let efficiency compound your DeFi journey.


No comments yet. Be the first to share your thoughts!