
Stablecoin pairs like USDC-USDT and DAI-USDC thrive in low-volatility environments, where concentrated liquidity strategies unlock superior capital efficiency without the wild swings of volatile assets. Liquidity providers (LPs) can position their capital tightly around the $1 peg, minimizing slippage for traders while maximizing fee capture. This approach, pioneered in protocols like Uniswap V3 and refined in Curve Finance's Stableswap, transforms traditional AMMs into precision tools for stablecoin AMM low volatility trading.
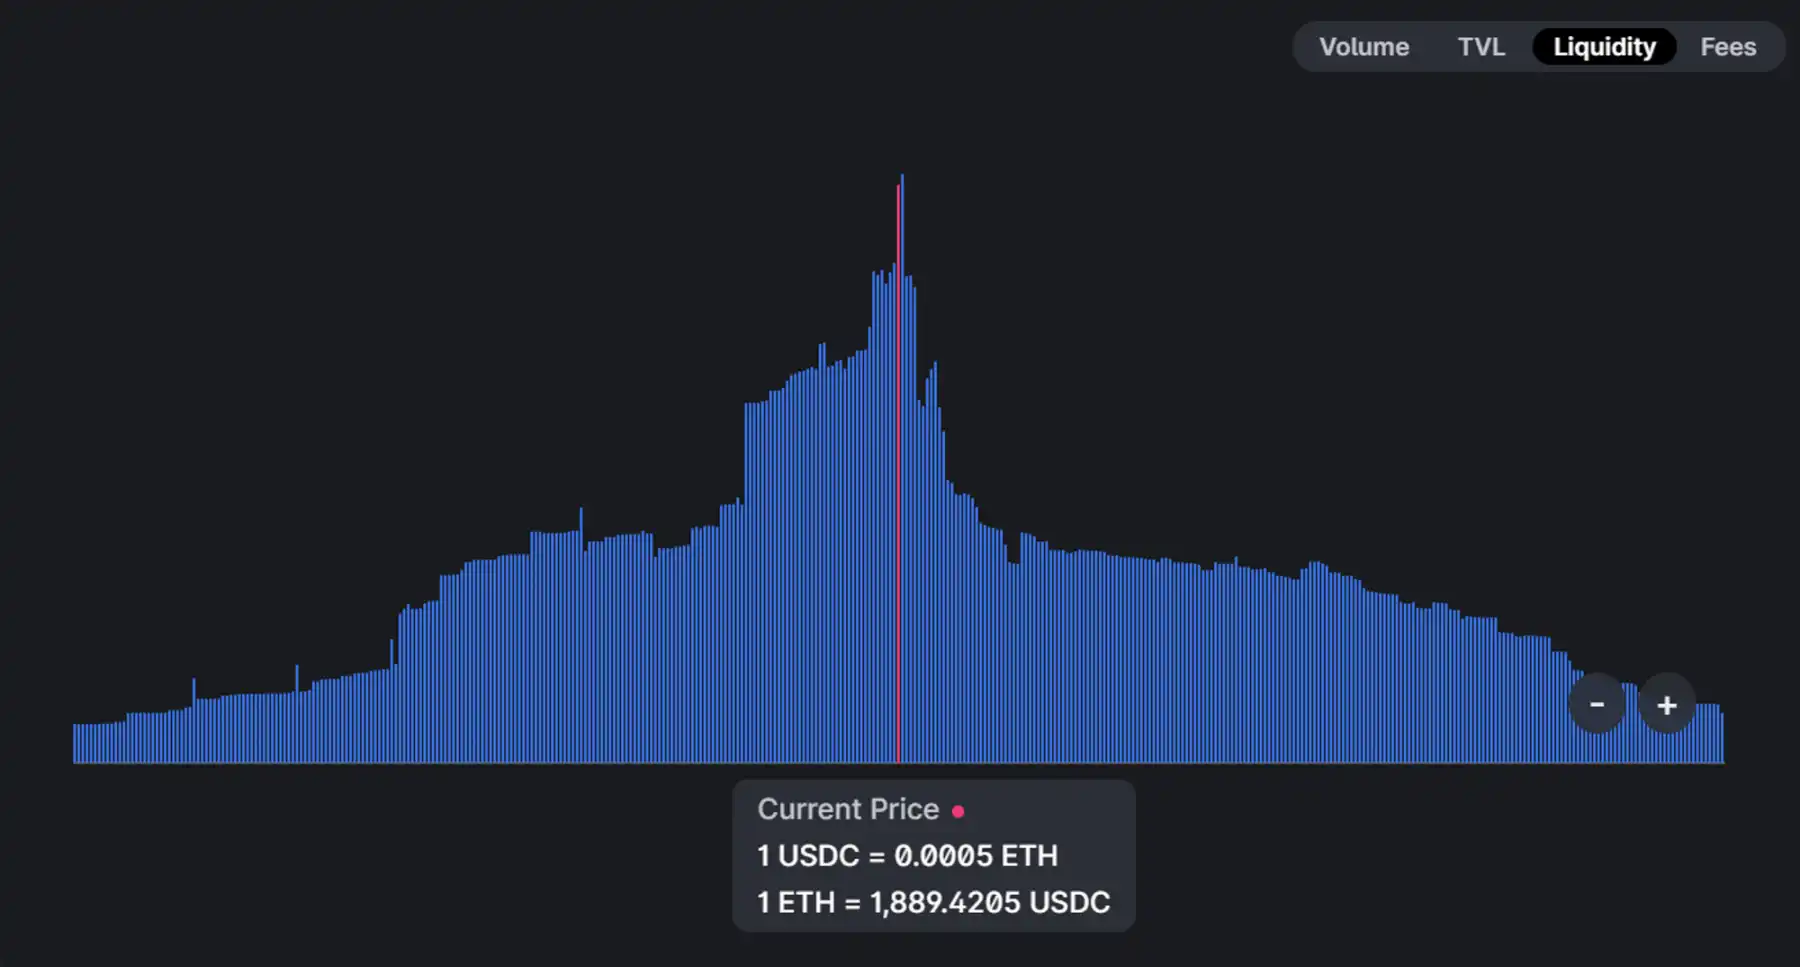
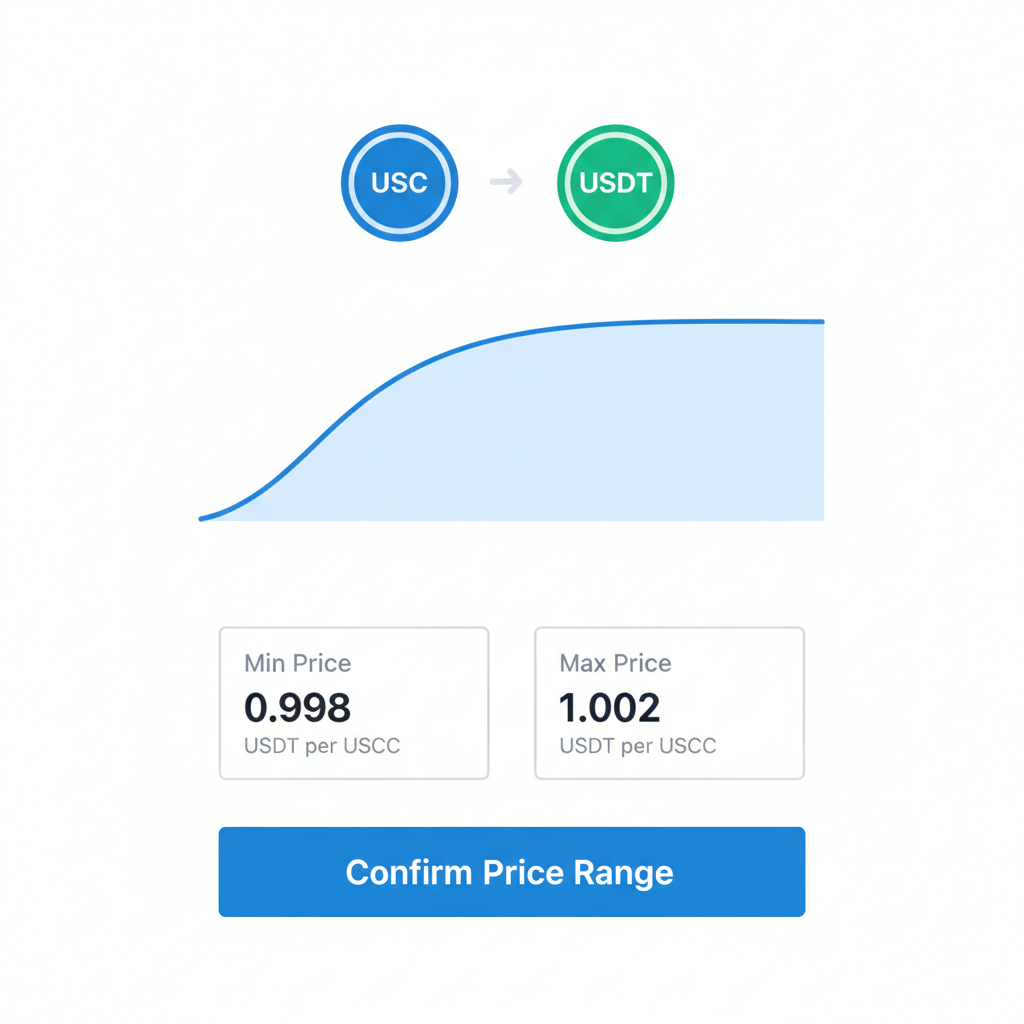
In essence, concentrated liquidity allows LPs to select narrow price ranges, such as $0.998 to $1.002, where the bulk of trading volume occurs for pegged assets. This concentration delivers up to 4,000 times the efficiency of uniform distribution models, as seen in Uniswap V3 implementations. Yet, my conservative stance urges caution: while risks are lower than in volatile pairs, depegging events demand vigilant position management.
Mechanics of Liquidity Concentration in Stablecoin Pools
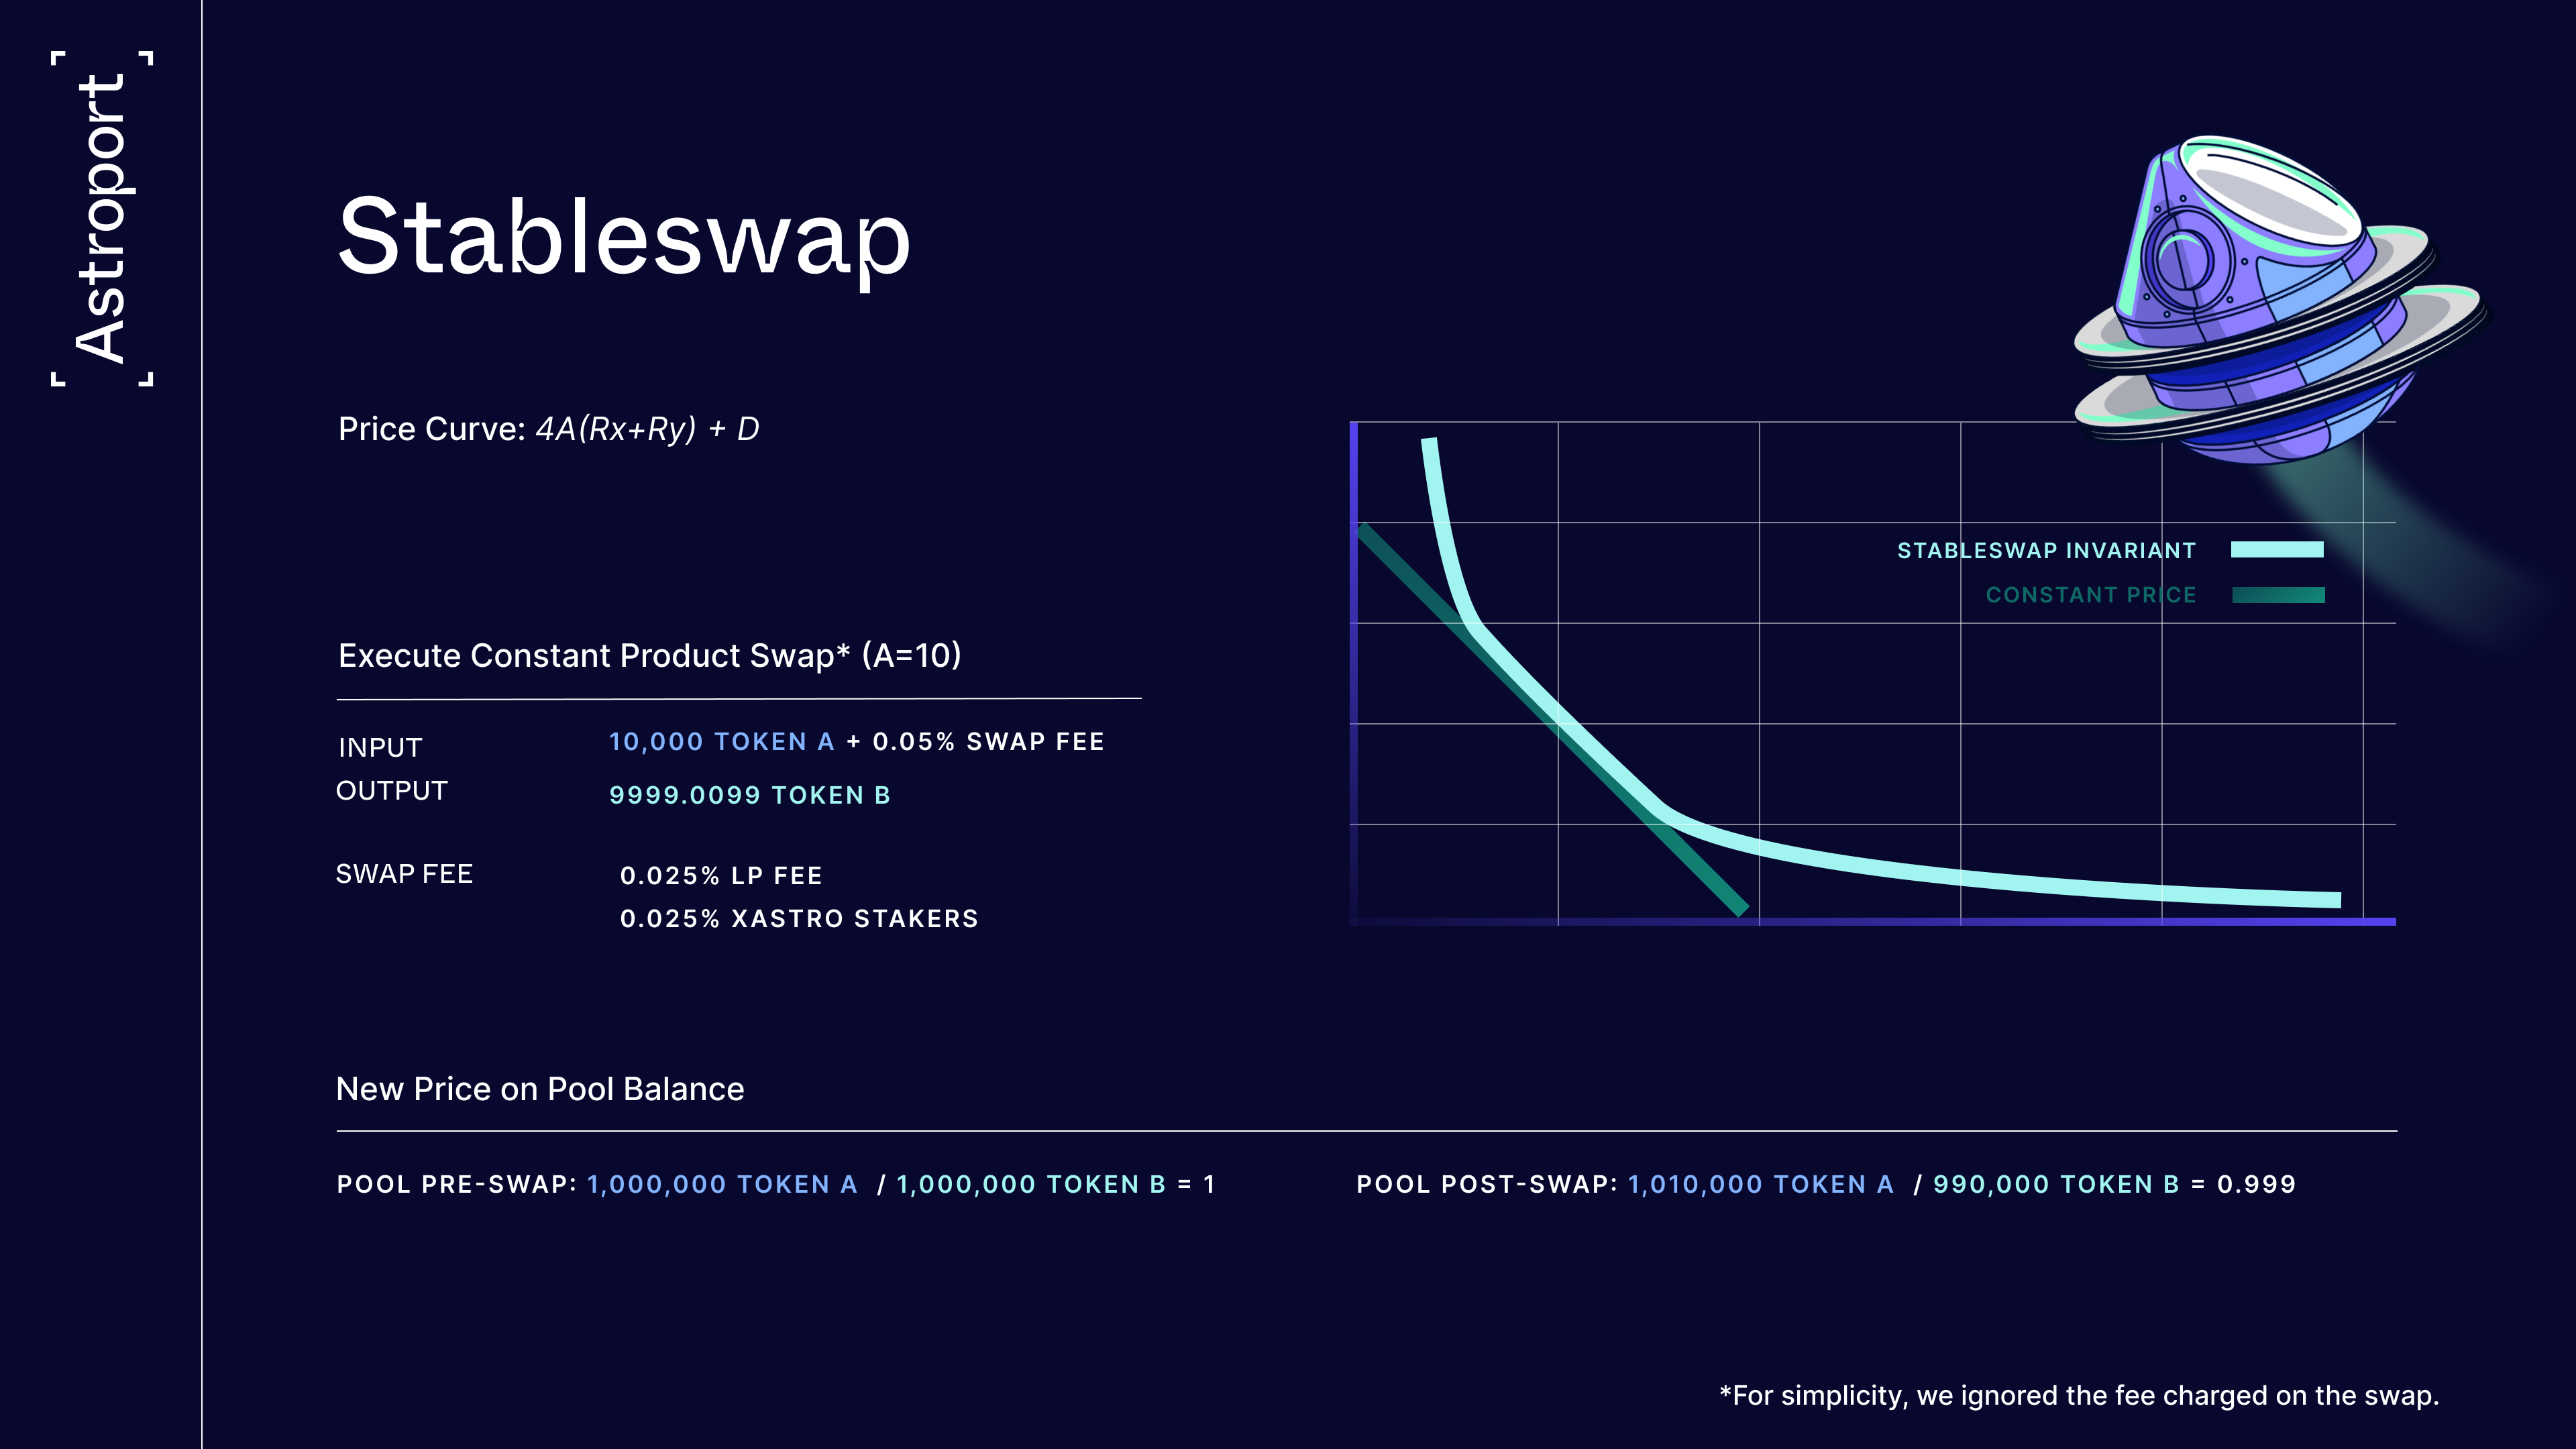
Curve Finance's Stableswap algorithm exemplifies this by mathematically biasing the bonding curve toward equilibrium prices. Unlike Cryptoswap pools for volatile assets, Stableswap pools for stablecoins like USDC, USDT, and DAI concentrate most liquidity around the 1: 1 exchange rate. A configurable parameter governs the curve's shape, dictating how aggressively liquidity densifies near the peg.
Consider a USDC-USDT pool: at equilibrium, swaps incur negligible slippage because depth is deepest precisely where trades happen. If prices drift, say to $1.001, the pool's hybrid constant sum-constant product formula gently rebalances without punishing LPs excessively. This setup provides higher effective liquidity than standard x*y=k models, ideal for low slippage stable pairs.

Capital Efficiency Gains and Fee Optimization
For LPs, the allure lies in amplified returns on deployed capital. By narrowing ranges, you forgo broad exposure but earn a disproportionate share of fees from high-volume trades within that band. Platforms like Curve extend this via metapools and composable stable pools (CSPs), letting providers sidestep volatile base assets entirely.
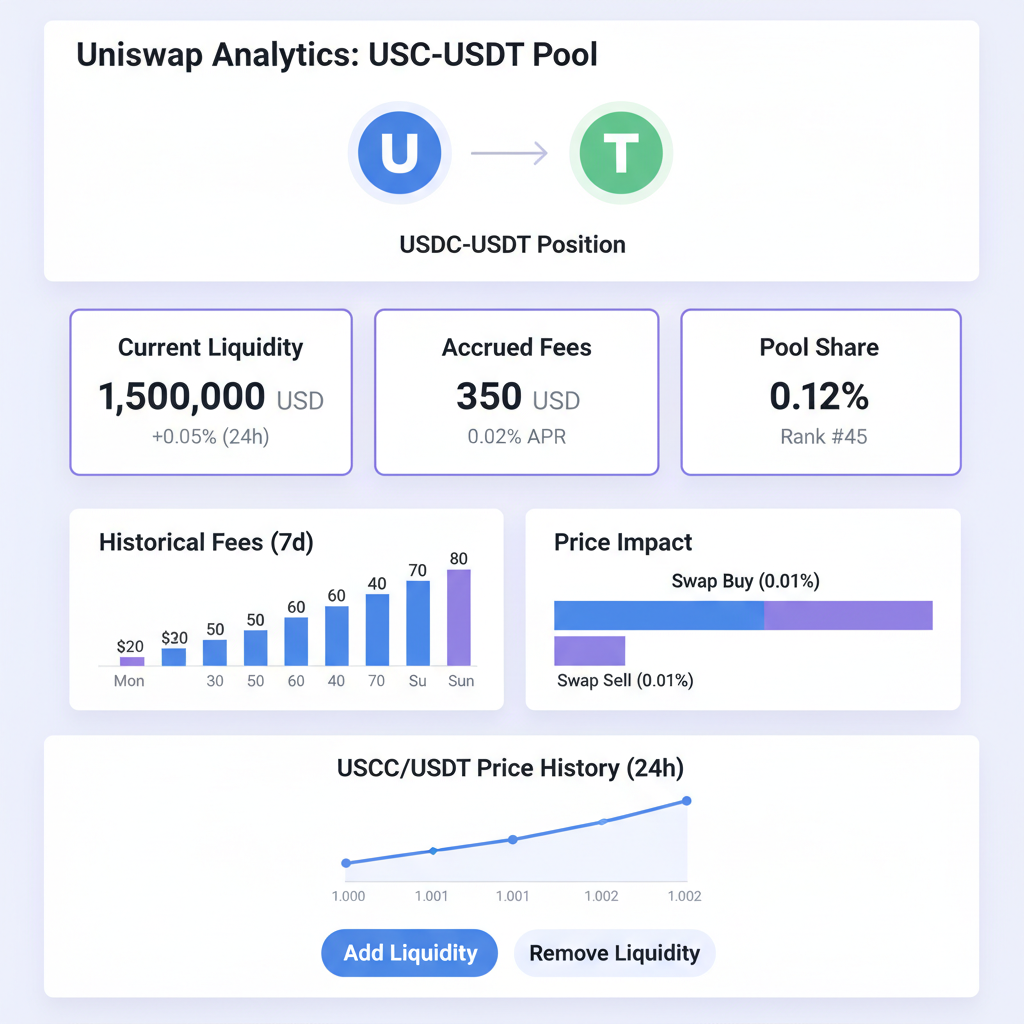
Take USPD-USDC pools: both pegged to USD, they leverage Stableswap for minimal slippage. LPs benefit from steady volume driven by arbitrageurs correcting minor deviations. Data from recent analyses shows these strategies yielding risk-adjusted returns superior to broad-market farming, provided positions overlap multiple ticks to hedge wanderings.
| Pool Type | Liquidity Concentration | Slippage for $10k Swap | LP Fee APR (Est. ) |
|---|---|---|---|
| USDC-USDT (Stableswap) | 95% around $1 | and lt;0.01% | 5-15% |
| DAI-USDC (Concentrated) | Custom $0.998-$1.002 | and lt;0.005% | 8-20% |
| Traditional AMM | Uniform | 0.5-2% | 2-8% |
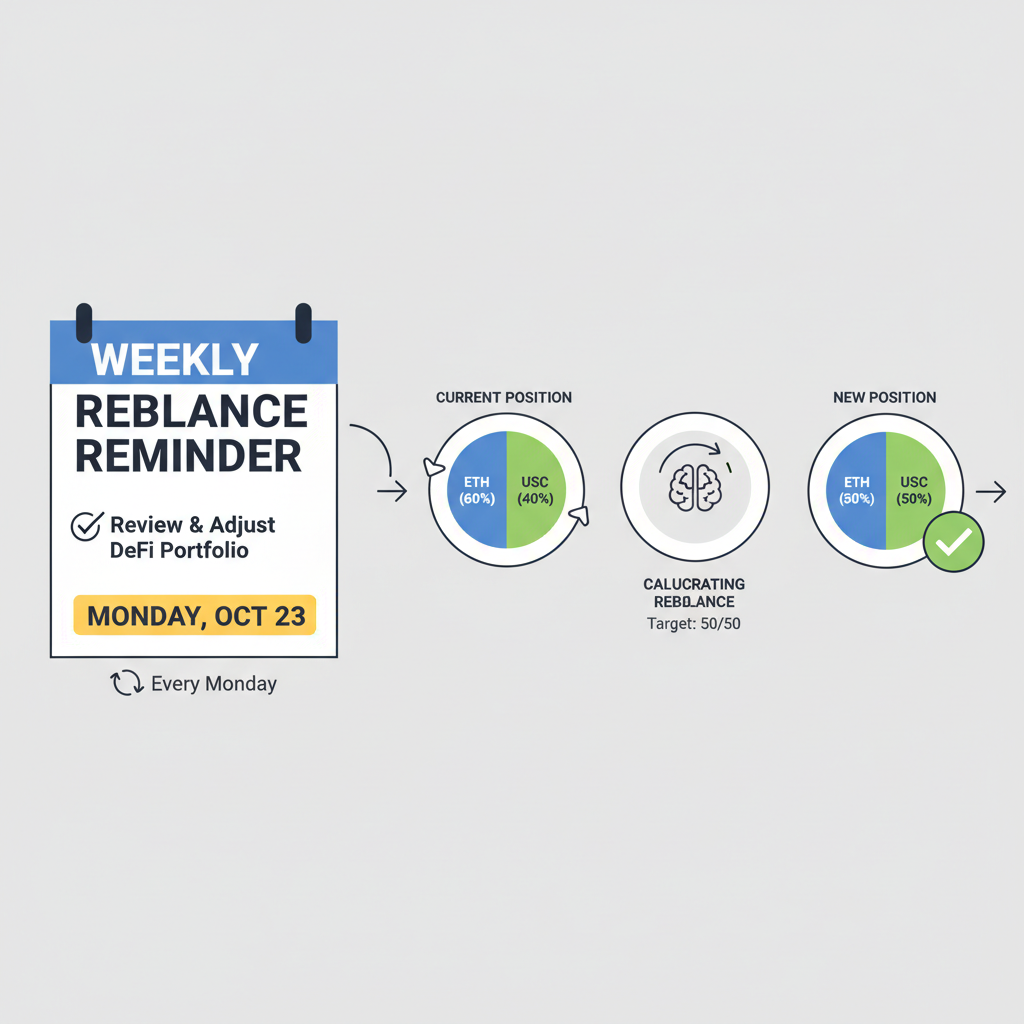
This table underscores the edge: stablecoin LP strategies in concentrated setups crush uniform pools on efficiency metrics. However, active rebalancing is non-negotiable; idle capital outside ranges accrues zero fees and invites one-sided exposure.
Risk Mitigation in Low-Volatility Concentrated Positions
Depegging remains the specter haunting even stable pairs. Historical lapses, like brief USDT wobbles, highlight vulnerabilities if liquidity bands exclude outlier prices. My advice: diversify across overlapping ranges and monitor peg stability via on-chain oracles.
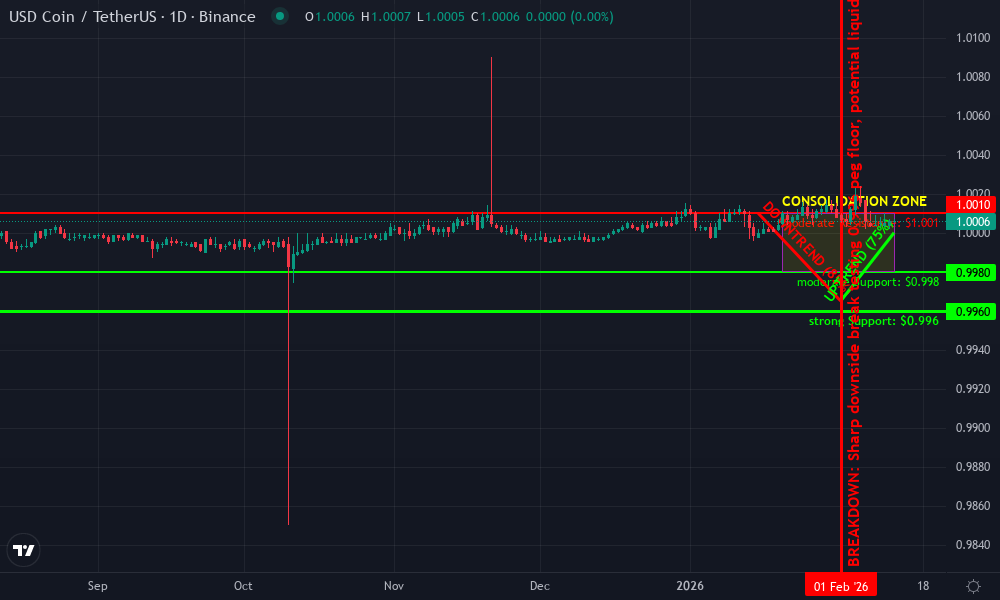
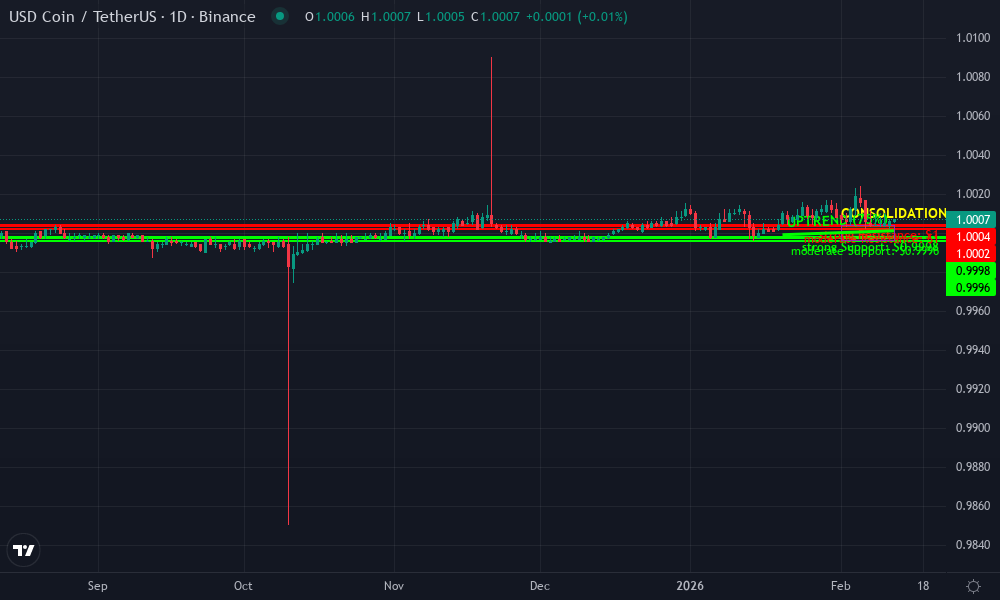
USDC/USDT Technical Analysis Chart
Analysis by Market Analyst | Symbol: BINANCE:USDCUSDT | Interval: 1D | Drawings: 7
Technical Analysis Summary
As a balanced technical analyst with 5 years specializing in technical patterns, draw the following on this USDC/USDT chart to highlight the tight peg stability and recent dip recovery: 1. Horizontal lines at key support (0.996 strong, 0.998 moderate) and resistance (1.001 moderate, 1.004 weak) levels using 'horizontal_line'. 2. Uptrend line from the Jan low connecting to current recovery using 'trend_line'. 3. Rectangle for the ongoing consolidation zone around the 1.000 peg. 4. Callouts on volume spikes during the dip and MACD bullish cross. 5. Vertical line at the recent breakdown point. 6. Entry/exit markers for range trading with medium risk tolerance.
Risk Assessment: low
Analysis: Ultra-low volatility inherent to USDC/USDT stable pair, tight 0.4% range with quick mean reversion; aligns with medium risk tolerance for range plays amid 2026 concentrated liquidity focus
Market Analyst's Recommendation: Range trade the 0.998-1.001 band; avoid directional bets unless depeg signals emerge
Key Support & Resistance Levels
📈 Support Levels:
- $0.996 - Strong historical low from Jan dip, peg floor with volume confirmation strong
- $0.998 - Moderate intraday support, aligns with concentrated liquidity bands moderate
📉 Resistance Levels:
- $1.001 - Moderate ceiling tested multiple times, upper peg bound moderate
- $1.004 - Weak prior high, unlikely without depeg catalyst weak
Trading Zones (medium risk tolerance)
🎯 Entry Zones:
- $0.998 - Bounce from moderate support in consolidation, low-risk long for peg reversion low risk
- $1.001 - Short entry at resistance fade, medium risk for range scalp medium risk
🚪 Exit Zones:
- $1.002 - Profit target at midpoint resistance for longs 💰 profit target
- $0.996 - Stop loss below strong support to cap downside 🛡️ stop loss
- $0.997 - Profit target for shorts at support 💰 profit target
Technical Indicators Analysis
📊 Volume Analysis:
Pattern: spike on downside
Elevated volume during Jan dip indicates distribution but absorption on recovery
📈 MACD Analysis:
Signal: bullish crossover
MACD histogram flipping positive post-dip, confirming reversal momentum
Applied TradingView Drawing Utilities
This chart analysis utilizes the following professional drawing tools:
Disclaimer: This technical analysis by Market Analyst is for educational purposes only and should not be considered as financial advice. Trading involves risk, and you should always do your own research before making investment decisions. Past performance does not guarantee future results. The analysis reflects the author's personal methodology and risk tolerance (medium).
Curve's innovations, including gauge weights for incentivized pools, further tilt odds toward LPs. By voting CRV tokens into high-volume stableswap pools, providers amplify yields conservatively. Yet, over-reliance on incentives risks opportunity cost if emissions shift; prioritize organic volume in Curve Finance Stableswap selections.
Overlapping positions mitigate gaps: one tight band for core efficiency, wider flanks for resilience. This layered defense ensures continuous accrual, even as prices test $0.999 or $1.001. Empirical evidence from Uniswap V3 stablecoin positions validates this, with managed portfolios outperforming passive ones by 2-3x on Sharpe ratios.
Active management elevates these strategies from theoretical gains to reliable income streams in stablecoin AMM low volatility setups. Tools like position trackers and alert bots assist, but LPs must calibrate ranges based on historical volatility, typically confining core allocations to 0.1% deviations from $1 for pairs like USDC-USDT.
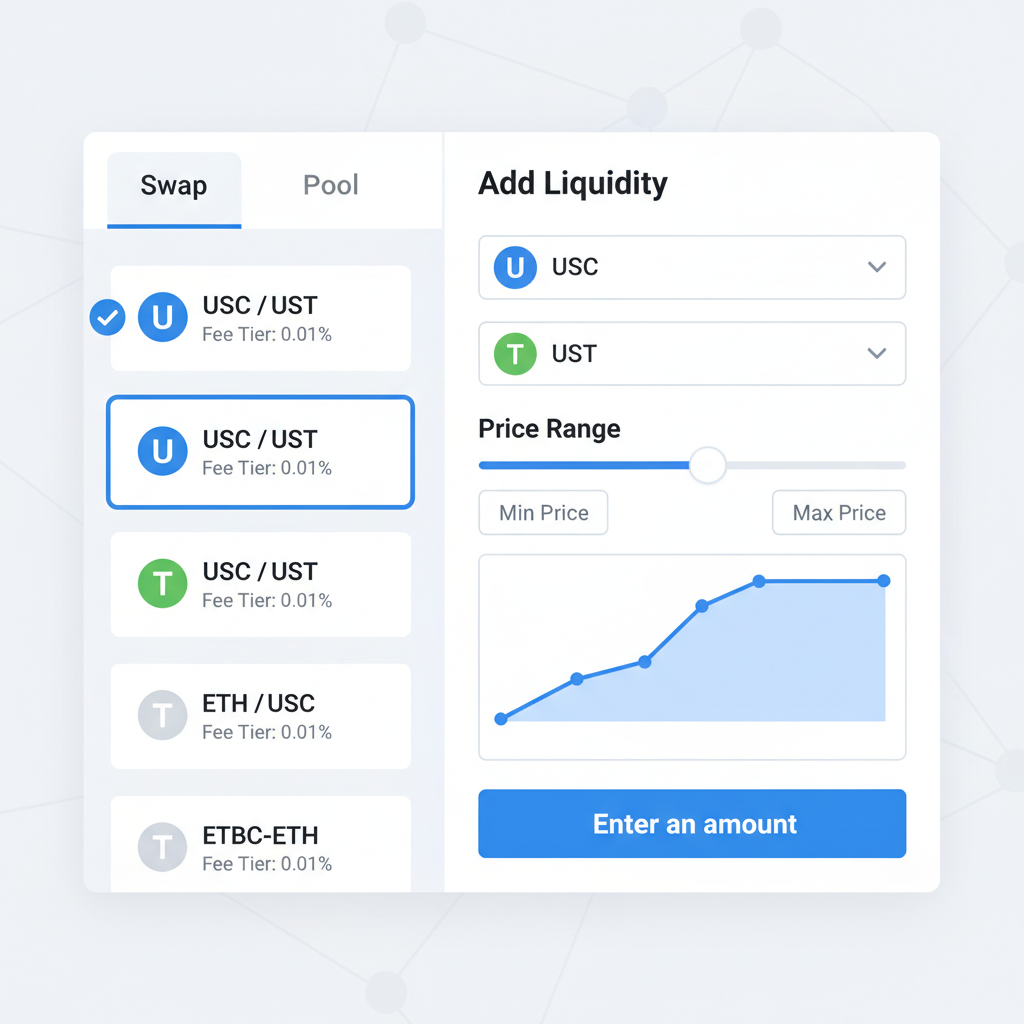
Deploying Positions: A Conservative Roadmap
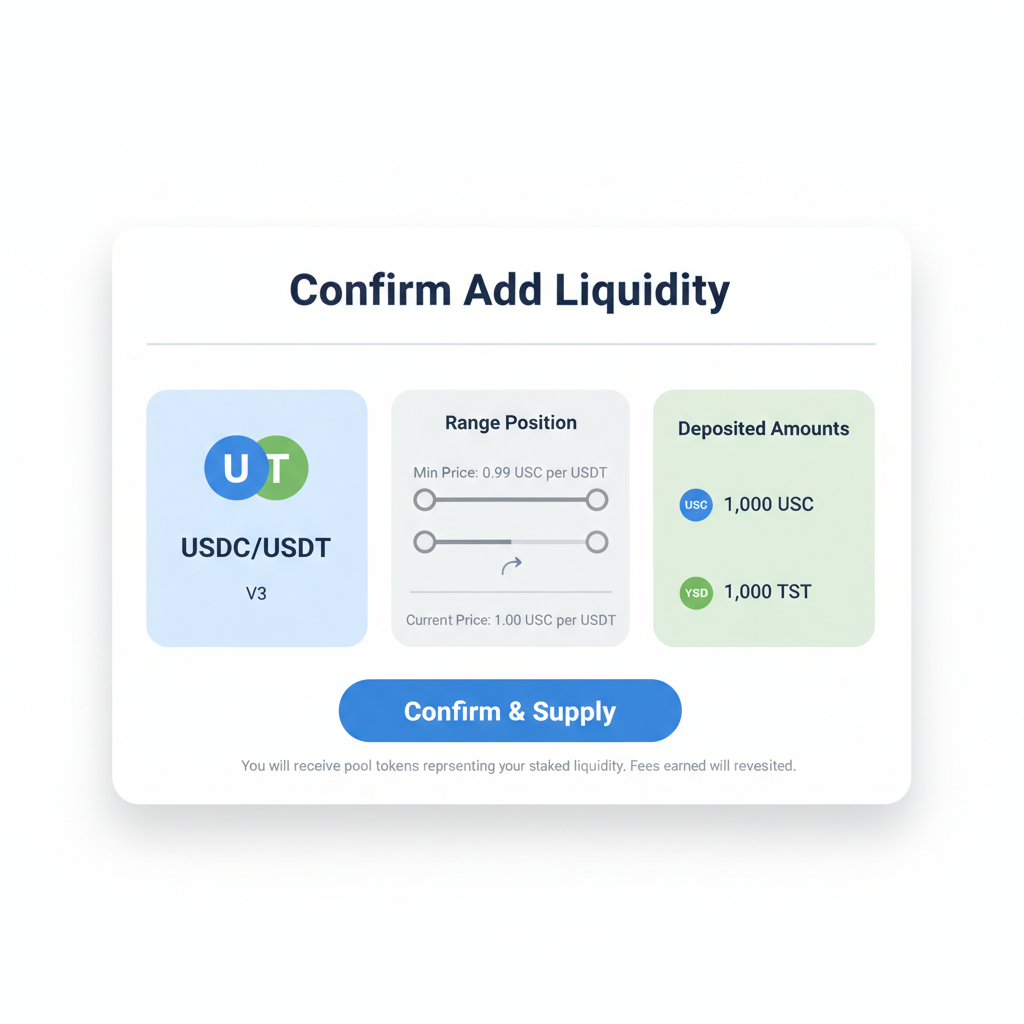
Platforms such as Uniswap V3 demand precision in tick selection, where each tick represents a discrete price point. For DAI-USDC, positioning liquidity from tick -100 to and 100 around $1 captures 99% of volume while buffering minor drifts. Curve's Stableswap, conversely, automates concentration via its amplification factor, often set above 100 for ultra-tight curves, rendering manual ticks unnecessary yet equally potent.
Deploying Concentrated Liquidity for USDC-USDT: Conservative LP Guide
This methodical approach minimizes one-sided risks. In practice, allocate 60% to a primary tight band, 30% to medium flanks ($0.995-$1.005), and 10% to wide sentinels, ensuring layered protection. Backtests on USDC-USDT data reveal such portfolios sustaining 12-18% APR amid 2023 peg tests, far outpacing uniform LPs.
CSPs on Curve add composability: LPs deposit stables into a metapool backed by a volatile asset pool without direct exposure, blending Stableswap efficiency with crvUSD-like collateralization. This hybrid sidesteps impermanent loss entirely, ideal for conservative yield hunters targeting Curve Finance Stableswap gauges.
Benchmarking Performance Across Protocols
Quantitative comparisons affirm the hierarchy. Stableswap pools consistently deliver sub-0.01% slippage on $10k swaps, versus 0.005% in optimally ranged V3 positions. Gauge incentives amplify this: high-weight pools like 3pool (USDC-USDT-DAI) distribute 20-50% extra CRV emissions, but select based on TVL-to-volume ratios exceeding 10: 1 for sustainability.
| Protocol | Concentration Method | Capital Efficiency Multiplier | Depeg Resilience (1% Drift) |
|---|---|---|---|
| Curve Stableswap | Amplification Factor | 50-200x | Active (Auto-Rebalance) |
| Uniswap V3 | Ticks ($0.998-$1.002) | Up to 4,000x | Passive (Requires Manual) |
| Balancer Weighted | 50/50 Pegged Weights | 10-20x | Moderate |
These metrics highlight why low slippage stable pairs favor concentration: Stableswap edges on passivity, V3 on raw efficiency. My 12 years in quant finance reinforce prioritizing Sharpe-optimized pools, where volatility-adjusted yields exceed 1.5.
Beyond deployment, vigilance against black swans defines longevity. Integrate oracle feeds for peg alerts; a 0.5% deviation warrants partial withdrawal. Diversify across 3-5 pools, capping any at 20% portfolio allocation, to weather correlated depegs.
Innovation persists: emerging CLAMM variants on Arbitrum layer concentrated stableswap with just-in-time liquidity, slashing gas while preserving depth. Yet, stick to battle-tested venues like Curve for principal safety. Layered ranges, protocol selection, and disciplined rebalancing forge resilient stablecoin LP strategies, turning low-volatility AMMs into bastions of steady DeFi returns.
USDC / USDT Technical Analysis Chart
Analysis by Market Analyst | Symbol: BINANCE:USDCUSDT | Interval: 1D | Drawings: 6
Technical Analysis Summary
In my balanced technical style, start by drawing horizontal_lines at key support (0.9998) and resistance (1.0004) to highlight the tight peg range. Add a trend_line connecting higher lows from mid-January 2026 for the subtle uptrend. Use rectangle to box the ongoing consolidation zone from early February. Mark the recent volume spike preceding the minor dip with an arrow_mark_down callout. Place text labels on MACD bullish divergence and volume pattern. Finish with entry/exit zones using order_line for long position at 1.0000 targeting 1.0003.
Risk Assessment: low
Analysis: Stablecoin pair with proven peg resilience and low volatility; concentrated liquidity minimizes slippage risks per 2026 context
Market Analyst's Recommendation: Range-bound long with tight stops, aligning medium risk tolerance for scalps
Key Support & Resistance Levels
📈 Support Levels:
- $1 - Multiple tests on recent dip, strong peg hold strong
- $1 - Session low with volume support moderate
📉 Resistance Levels:
- $1 - Recent swing high, liquidity cap moderate
- $1 - Upper range bound, prior peaks strong
Trading Zones (medium risk tolerance)
🎯 Entry Zones:
- $1 - Peg centerline bounce with volume confirmation medium risk
- $1 - Support retest in uptrend low risk
🚪 Exit Zones:
- $1 - Mid-resistance target 💰 profit target
- $1 - Below key support invalidation 🛡️ stop loss
- $1 - Breakout extension 💰 profit target
Technical Indicators Analysis
📊 Volume Analysis:
Pattern: spike on downside then taper
Declining volume on recovery suggests fading sellers, potential base
📈 MACD Analysis:
Signal: bullish divergence
MACD line crossing signal from below amid histogram expansion
Applied TradingView Drawing Utilities
This chart analysis utilizes the following professional drawing tools:
Disclaimer: This technical analysis by Market Analyst is for educational purposes only and should not be considered as financial advice. Trading involves risk, and you should always do your own research before making investment decisions. Past performance does not guarantee future results. The analysis reflects the author's personal methodology and risk tolerance (medium).

No comments yet. Be the first to share your thoughts!